
PCCA Journal|1
st
Quarter 2015
14
6UJMJUZ 0VUMPPL
Continued from page 13
T
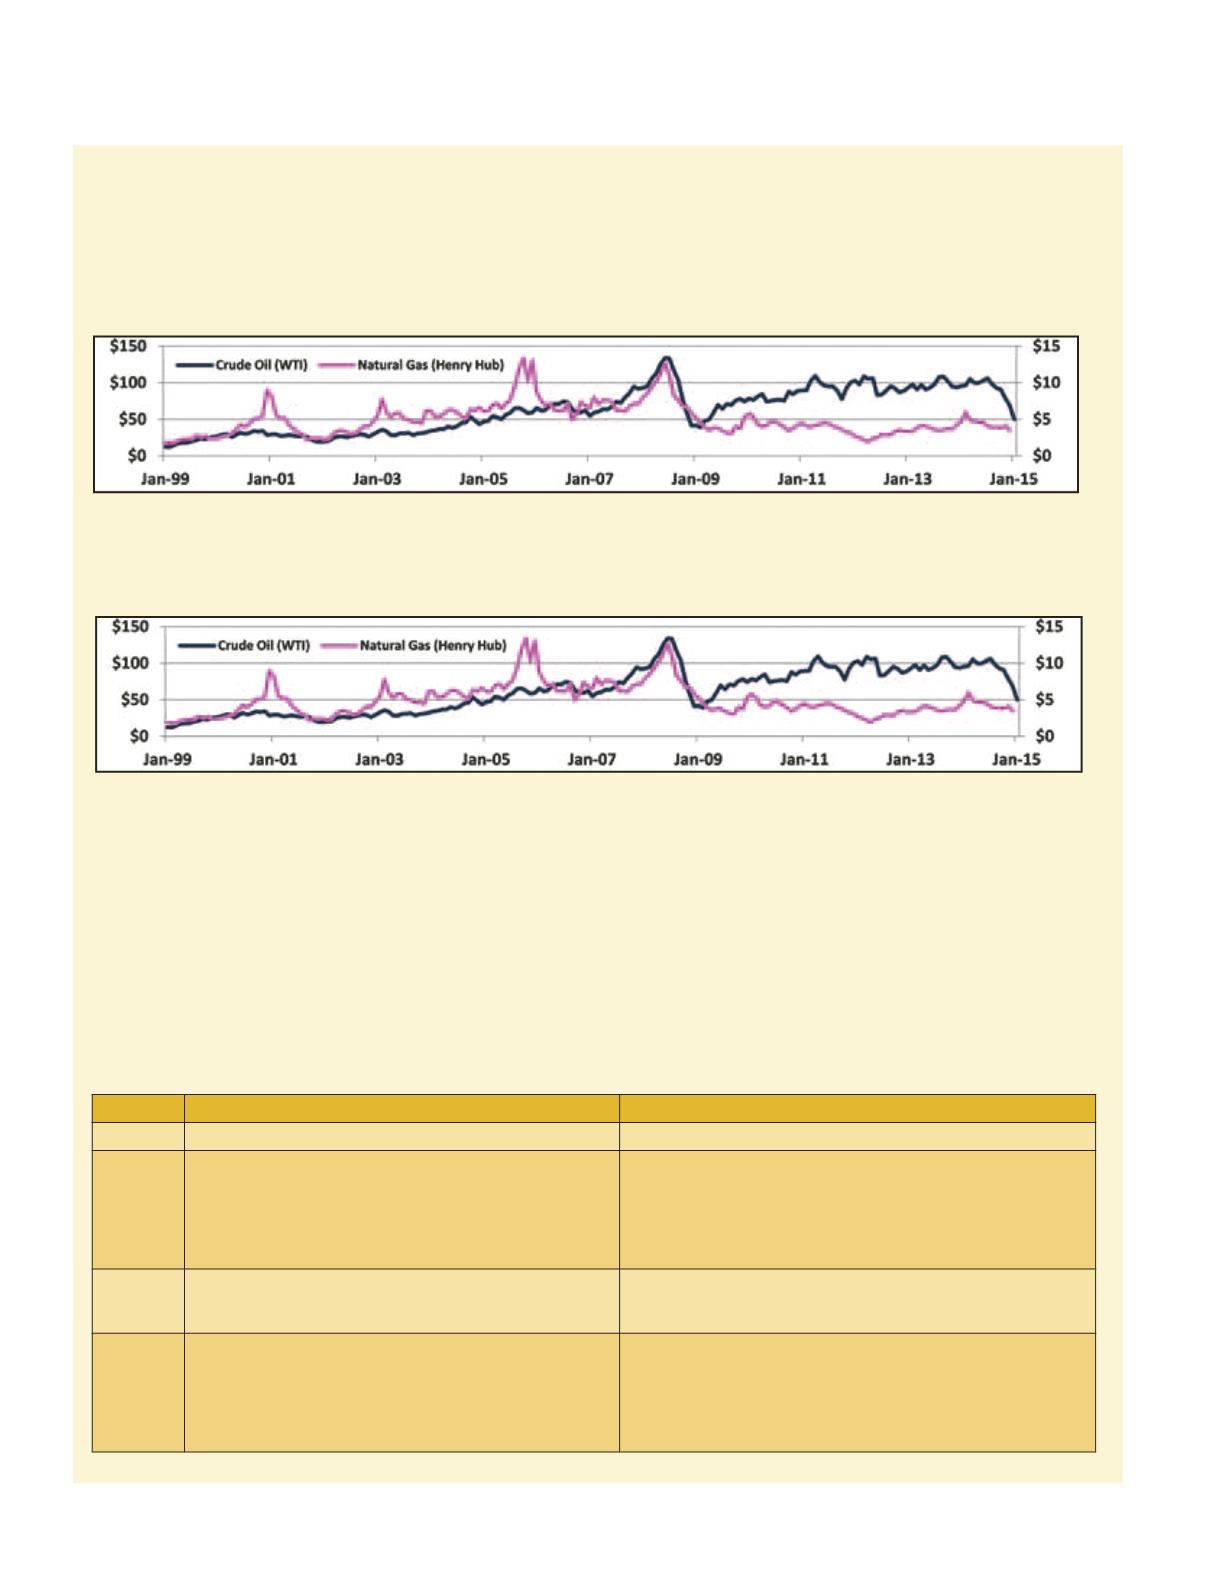
he freefalling oil price caught many observers off guard. Historically, crude oil and natural gas prices have tended to
stay in alignment as the imbedded energy content is the defining characteristic. Since 2010, when the pricing of these
commodities separated, many observers have anticipated upward volatility in the price of gas to realign it with the
price of oil. Few analysts anticipated oil falling to realign with low-cost natural gas.
Falling oil prices impact the competitiveness of U.S. shale oil plays. Example basin breakeven extraction costs demonstrate low
competitiveness in the $40-$60 range. While the reasons for the freefall in crude oil are highly complex and frankly not cur-
rently well explained, there is no doubt that it is creating both positive and negative implications.
Drivers for the falling oil price include the following:
s
Low Global Demand: The economic slowdown in Asia and Europe has reduced demand.
s
High Supply: Five years of $90+ oil led to massive investment in exploration and production.
s
OPEC Weakness: OPEC’s share of world supply is declining, members have grown fat domestic budgets fueled by high-priced
oil, and these countries want to protect their market share.Geo-Political Action: Saudi Arabian opportunity to economically
punish Russia, Iran, and Syria without directly harming the U.S. and inflicting moderate and manageable damage to their
domestic budget.
s
Speculation: It is not clear what role speculators play in the current crude oil price swing, yet there is general agreement that
speculative activity continues and is moving prices.
Impacts to shale oil and gas markets along with underground and pipeline contractors include the following:
Falling Oil Price Impact on Utility Construction
Market
Most Likely Outcome
Severe Outcome
18 or Less Month Price Down Cycle
3+Year Price Down Cycle
Shale Oil
Price #oor $45; recovery to $80-$90 in 2016
Exploration slows; Production #attens
Exploration spending falls modestly
Liquid pipeline construction #attens and is focused on reducing rail tra%c
Overall economic impact positive; +1% to GDP
Price falls below $40 and remains below $60
Exploration stops; Production #attens then falls
Exploration spending collapses
Liquid pipeline construction spending collapses
Overall economic impact uncertain to negative
E&P defaults damage capital markets
Shale Gas
Shale gas price remains stable/low
Rigs move back to wet gas basins
Capital spending is constrained
Same as above
Industrial and transportation use #attens
Collapse pushes natural gas price down
Contractors
Activity remains replacement and system capacity related
Flat transmission market for 2015 & 2016
Limited delay of new large pipeline projects
Reduced wage pressure
Distribution market remains strong with lower growth rate
Liquid market reduced to integrity work only
Gathering contractors enter and disrupt distribution market
Rate payer impact hurts distribution spend
Postponed distribution spend stresses existing system T&D capacity
Loss of workforce limiting growth post-2018
Constrained capital for high risk energy market
Continued on page 16


