
PCCA Journal|1
st
Quarter 2015
13
A future vision of what this widespread replacement of
distribution infrastructure might look like can be found in
Indiana and Virginia. Indiana’s Senate Enrolled Act 560 will
drive billions in spending on new transmission and distribu-
tion lines, new substations, upgrades to existing lines and
substations, and replacement of aging poles, transformers,
line equipment and other infrastructure. The wording of a
portion of the legislation reads, “...the utility may then adjust
rates every 6 months, subject to Indiana Utility Regulatory
Commission and Indiana Office of Utility Consumer Coun-
selor review, to recover 80 percent of the project costs as they
are incurred. The remaining 20 percent must be deferred un-
til the utility’s next base rate case, which must be filed before
the end of the seven-year period. The rate increases—under a
new Transmission, Distribution, and Storage System Improve-
ment Charge mechanism—may not exceed two percent of the
utility’s total annual retail revenues.”
2
In the case of Virginia,
state legislation requiring the undergrounding of at-risk elec-
tric distribution and transmission infrastructure could result
in $10 billion in spending over the long-term.
In Exhibit 4, an Energy Information Administration study
describes the range of possible outcomes for distributed solar
generation on buildings alone as significant with anywhere
from 17 to 75 gigawatts of generation potential.
3
Another
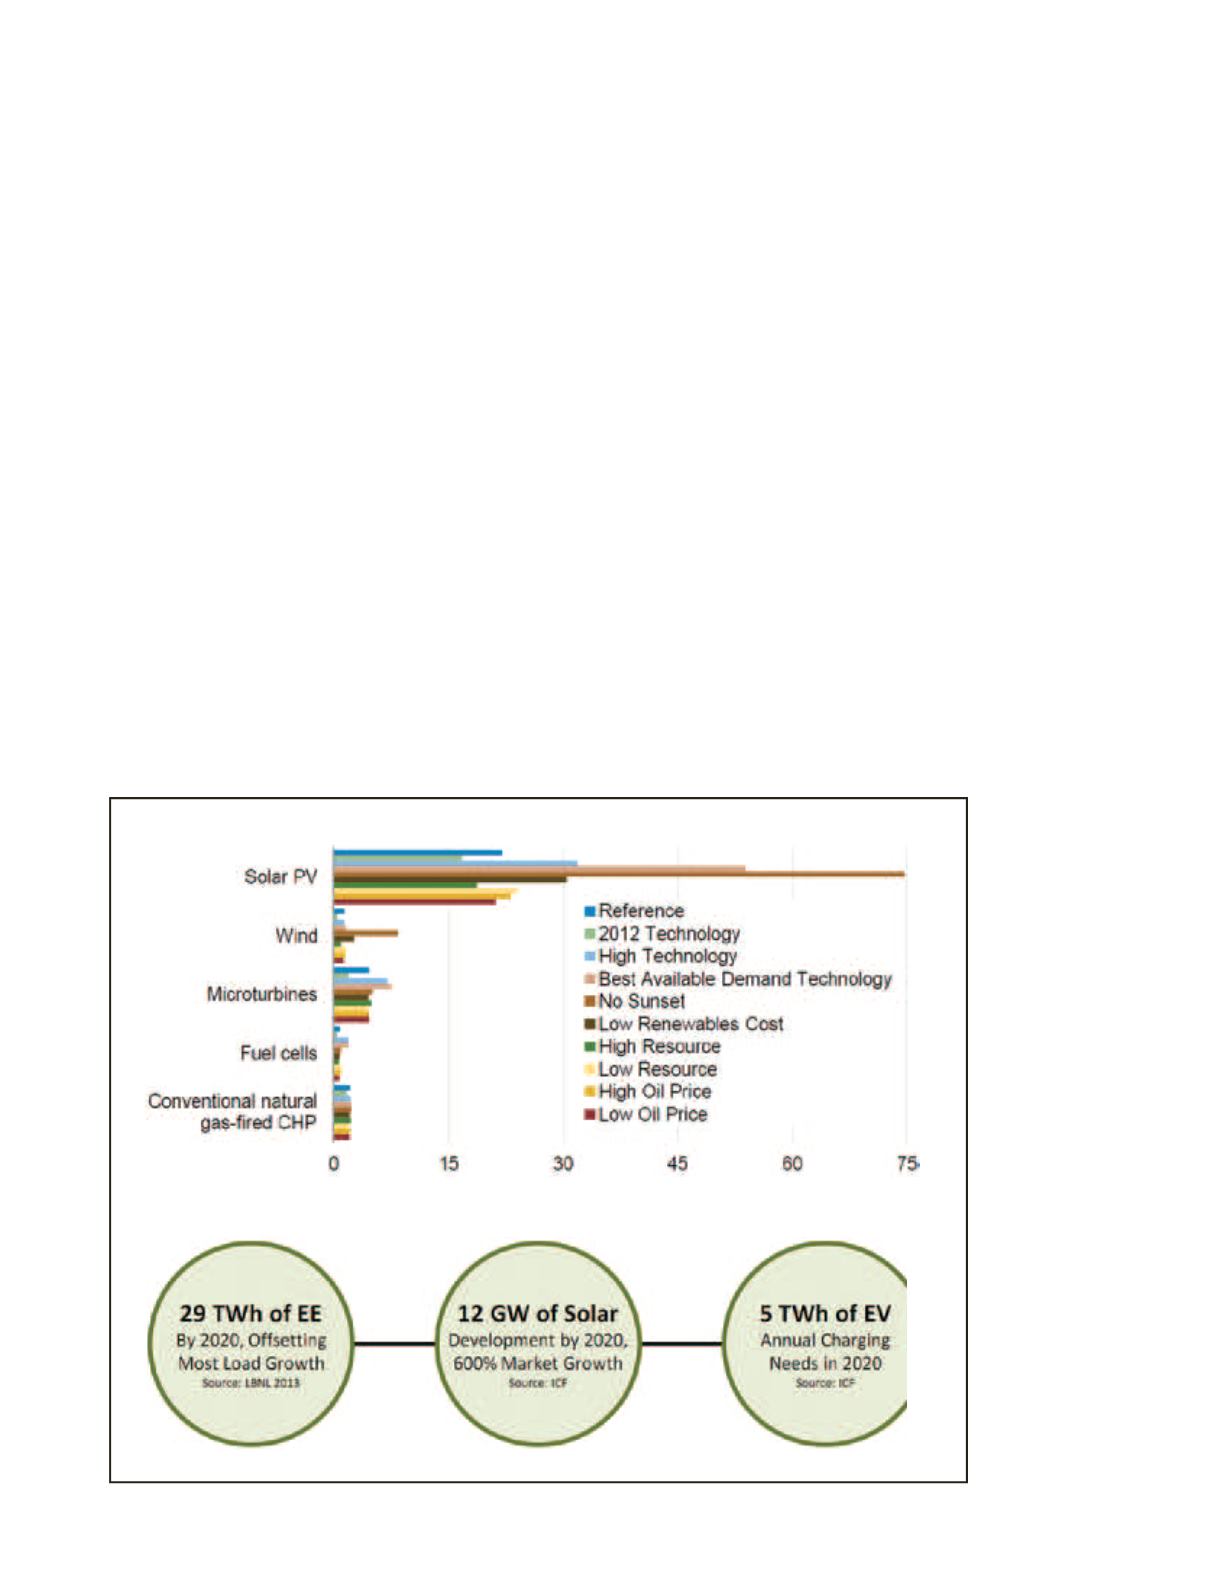
view from ICF International in Exhibit 5 forecasts significant
distributed energy resources by 2020 driving down the need
for traditional generation capacity.
4
As a frame of reference,
U.S. electricity consumption in 2012 was 4,069 terawatt
hours
5
, and the typical U.S. home consumes 10,837 kilowatt
hours of electricity annually.
6
The addition of other forms of
distributed generation and energy efficiency will further drive
disruption.
The communication industry may predict the path of
the electric market. Beginning with the breakup of the Bell
system in 1982, the industry experienced 30 years of rapid
change involving technology, ownership structure, and cus-
tomer demands. Organizations that were not nimble simply
do not exist anymore. This fact should serve as a warning to
electric utilities that are just beginning a period of fundamen-
tal change and disruption.
Gas and Liquid Transmission & Distribution
Pipeline spending remains on a tear. The primary driver is re-
placement activity in the first half of our forecast period and
subsequently by an industrial and power generation renais-
sance that will result
in the strengthening
of systems across
the country, par-
ticularly in regions
where shale oil and
gas are located. We
have received many
questions about the
falling price of oil; it
will have an impact,
just not the one envi-
sioned. (See “Falling
Oil Price Impact on
Utility Construction”
on page 14.) This
activity will also
include new trans-
mission and high
pressure distribution
spurs. The long-
term prospects and
spending rational are
detailed in Exhibit 6.
Continued on page 14
Exhibit 4
Exhibit 5


