PCCA Journal|2
nd
Quarter 2014
14
unabated in this sector through
the forecast period of 2017 (Ex-
hibit 2).
As a frame of reference,
electric and gas construction has
experienced more than a decade
of spending growth, moving from approximately $20 billion
in 2004 to more than $60 billion in 2014 and potentially $80
billion in 2017.
In a more specific and long-range perspective, it is Con-
tinuum’s belief and forecast that the pipeline construction
market will experience three 5- to 7-year waves of spending
increases. The first wave
began in earnest in 2010 to
2012 and will flatten out
in approximately 2015 to
2017, after which point it
will again accelerate. A
second and third wave will
also take place. Continuum
recently presented this
forecast at the American
Gas Association Opera-
tions Conference during a
program titled “Pipeline
Replacement Wave 2: 2014-
2020.” In this program, the
case was laid out for growth
in the pipeline market alone
from roughly $40 billion
today to roughly $80 billion by 2027.
After which, the pipeline market
spending falls dramatically as much
of the pipeline infrastructure in the
United States will have been newly
built or replaced with high quality
and performance materials yielding a more effective and safe
system.
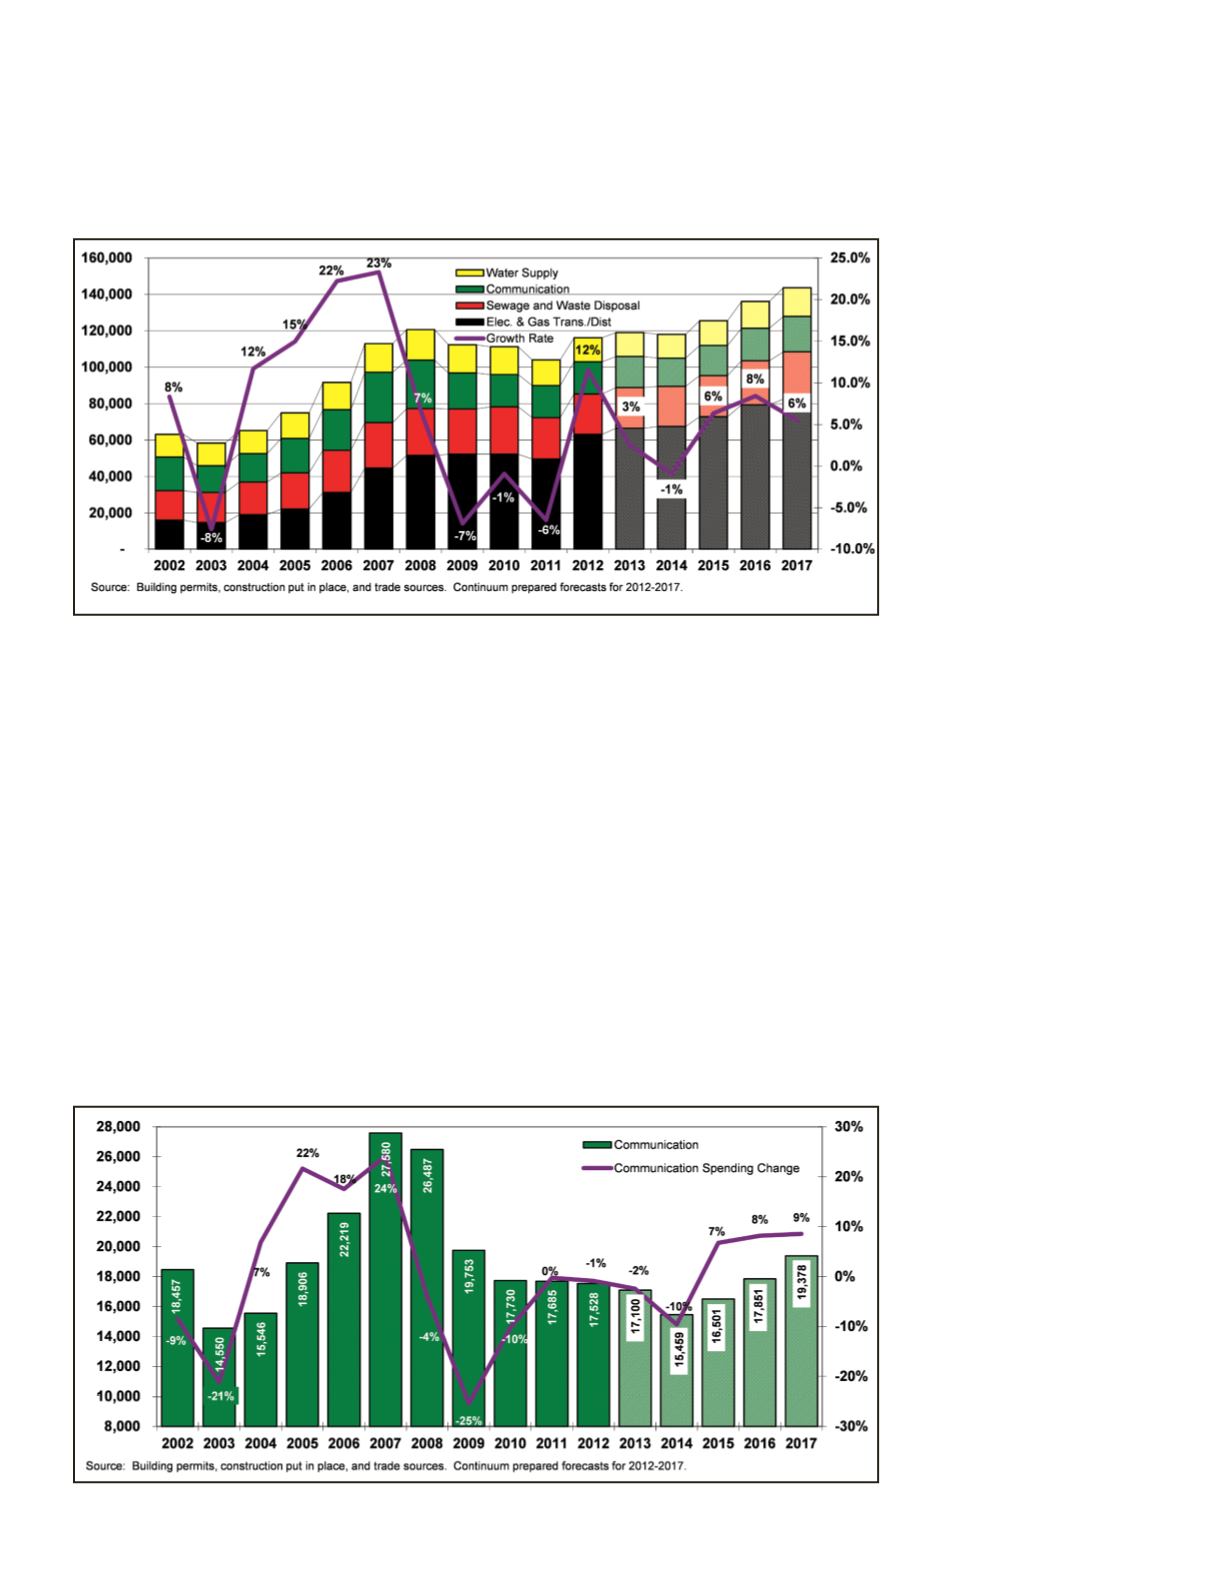
The telecom market, by comparison, is one where we have
not been as bullish recently and continued to describe some
of the fundamental challenges to this market that were con-
straining spending since 2012. Yet we continued to forecast
accelerating growth beyond
2015. We now have a clearer
perspective on what we
think may happen post 2014
and believe the Google,
AT&T, and other provider ef-
forts to either enter markets
in the case of Google or
defend them in the case of
the other service providers
will yield a short mini-boom
in telecom spending during
2015-2017 period (Exhibit
3).
The swings in construc-
tion spending yield swings
in perspective that are
evident in the UCI. Two
Exhibit 2
Utility Construction Put in Place Historical Figures and Forecasts
Millions of current dollars
Exhibit 3
Communications Construction Put in Place Historical Figures and Forecasts
Millions of current dollars
Good Times, Bad Times
Continued from page 13
“Pipeline [construction activity] is continuing despite
regulations by state and federal [authorities].”
– Large National Pipeline Contractor
Continued on page 16


