PCCA Journal|4
th
Quarter 2013
15
this sector, moving from approximately $20 billion in 2004 to
$80 billion in 2017. A combination of rising interest rates and
wage pressures will yield inflation that will slow spending as
the first wave of large programs and projects near completion
and ratepayer/PUC fatigue limits the size and scope of new
programs.
T&D Abundance vs. Scarcity
The disparity between abundance
and scarcity is the difference be-
tween the gas and electric markets.
The positive economic and safety
aspects of natural gas exploration,
production, gathering, and T&D are
so powerful as to drive construction
activity in both the pipeline and elec-
tric line sector. On the electric side,
the lower cost to produce power by
burning natural gas yields savings to
electric utility customers and creates
some breathing room for growth in
electric T&D construction activity.
Hurdles still exist.
Labor scarcity, particularly for
the capital construction and O&M
workforce within gas and electric
utilities, will prove a high hurdle.
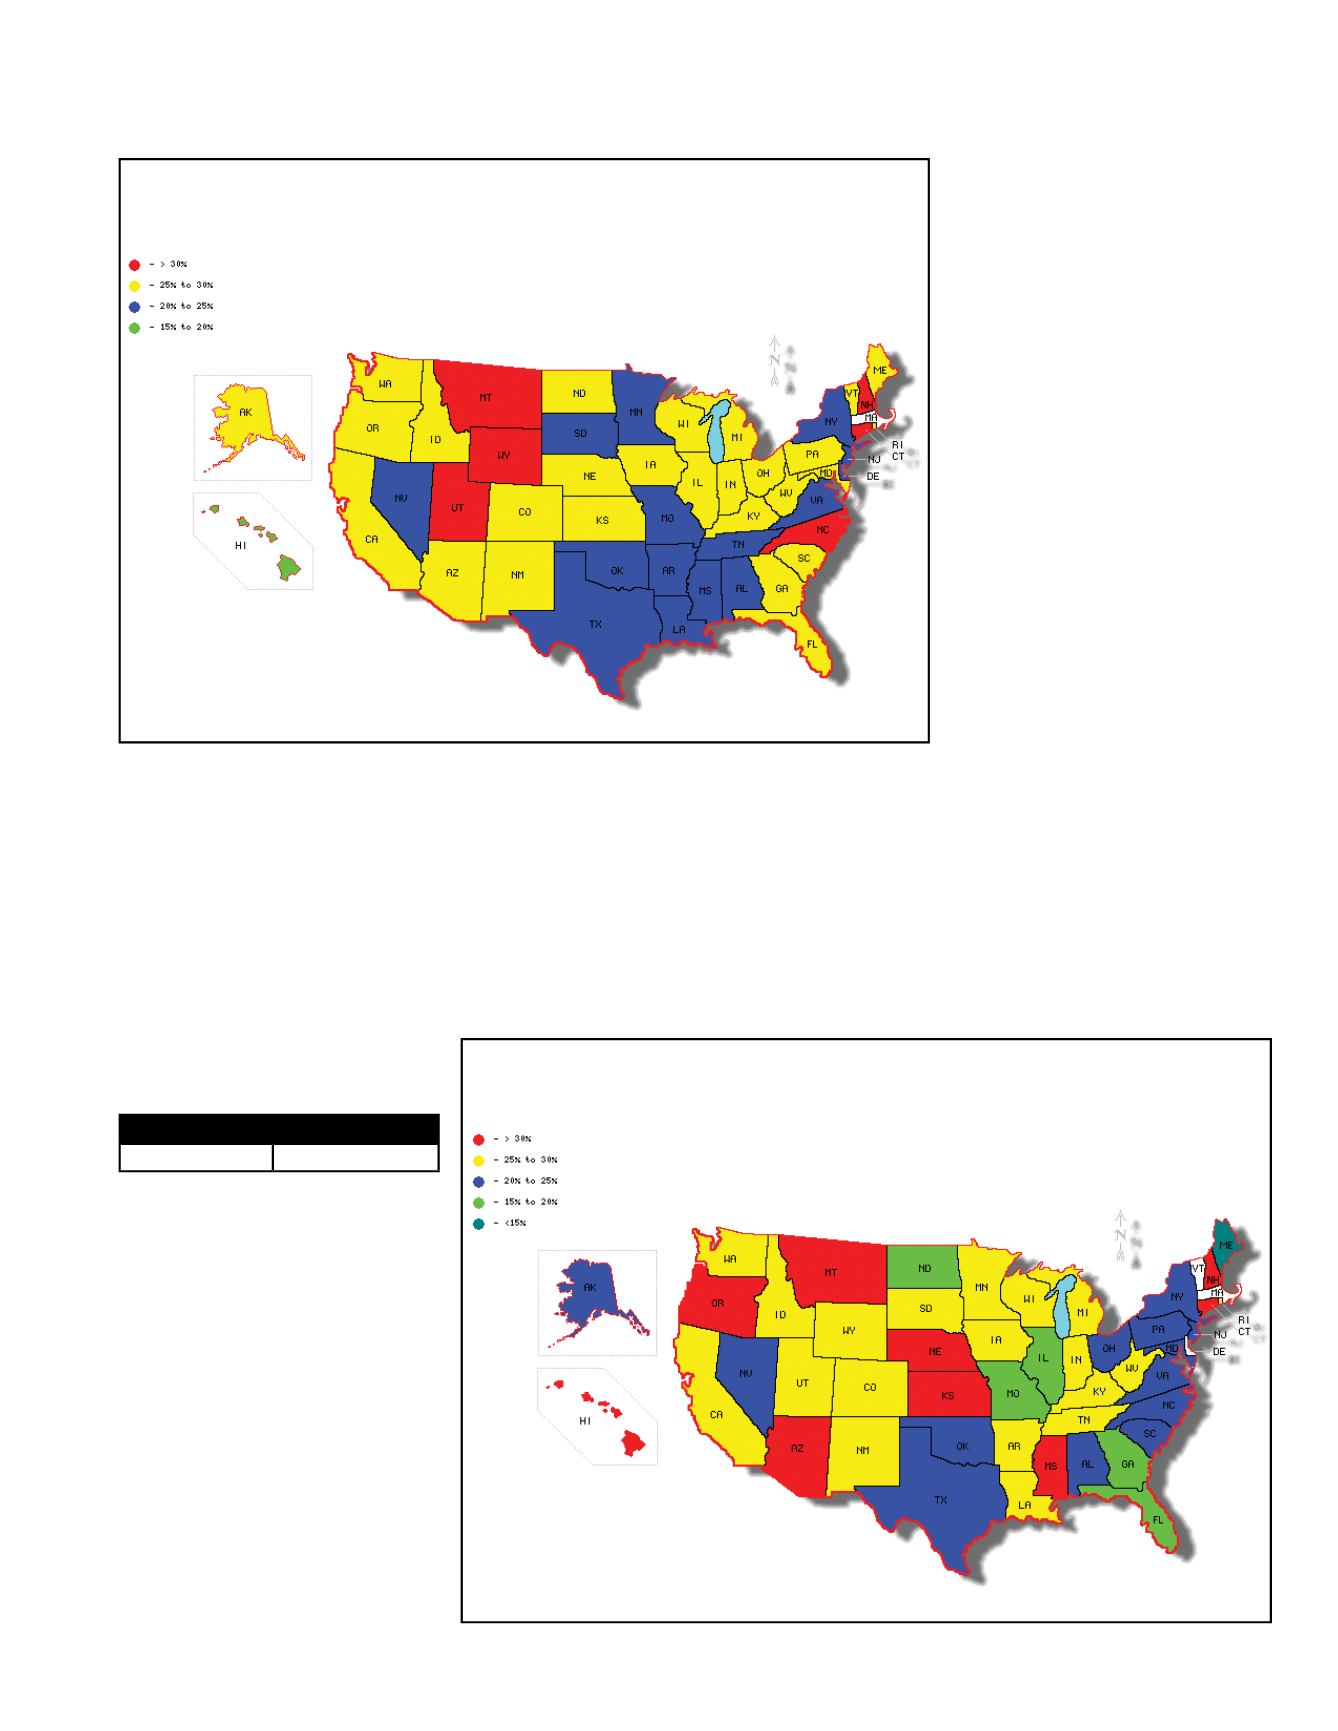
Twenty-four percent and 25 percent
of the electric T&D (Exhibit 3) and
gas T&D workforce (Exhibit 4)
respectively are over the age of 55.
Most of the Northern U.S. states
have a particularly old workforce.
6
Normally we would expect the next
generation, those currently 35 to 50
years old, to be stepping in to fill
the roles of the current baby boom
generation as they retire. Unfortu-
nately this next generation is some
4 million individuals smaller. In
addition, participation in the work-
force is falling. The 2008 recession
had a major effect on the labor
force participation rate, though this
only accelerated a trend rooted in
demographics. The participation
rate will not recover to previous levels regardless of economic
performance
7
(Exhibit 5). For perspective, if the participa-
tion rate was today what it was in 2003, there would be an
additional 5 million individuals in the workforce. Overcoming
this coming labor scarcity will require attracting the younger
generation, 20 to 35 year olds, as well as learning to do more
with less labor and management.
Continued on page 16
Exhibit 3
Electric T&DWorkforce over age 55 by State
Percent ofTotalWorkforce (No data for Mass.)
Exhibit 4
Gas T&DWorkforce over age 55 by State
Percent ofTotalWorkforce (No data for Del., Mass. &Vt.)
Abundance
Scarcity
• Gas-related activity • Electric-related activity


